Using
GB3VHF
Propagation
monitoring
The beacon can be used for determining if propagation conditions are
enhanced or have deteriorated over a period of time. Careful monitoring of the
beacon can give a useful indication that conditions are likely to improve, and
as such give rise to an early alert of an opening.
The beacon can be monitored using JT65B as shown on the Receiving GB3VHF page, and using the decoding
software the beacons signal strength can be monitored over a period of time,
even when inaudible in a conventional receiver bandwidth.
Another method is to use your receiver S meter reading to determine
relative signal strength again over a period of time and the data can be logged
using software. The software can then be used to display either in real time or
historically, a graph showing any changes to conditions.
An interesting account from Dave G8TTI of propagation conditions on the
21st of November 2011
Here is a recording that I made on the morning of the 21st of November of
the signal strength of the GB3VHF beacon which is located in Kent JO01EH, as
received here near Chippenham IO81WM. The beacon's signal strength usually
hovers around S6-7, but there was a clear enhancement in the morning. Doubtless
more distant repeaters and stations than normal were heard on FM. The line on
the graph is the signal strength of the beacon (-60dBm is S9+10db approx), with
time shown right to left. The recording starts at 1140z and ends at 1211z.
Weather at first was fog, with rain arriving at approximately 1145z and then
becoming more persistent. I consider that the deterioration of propagation
conditions is very apparent.
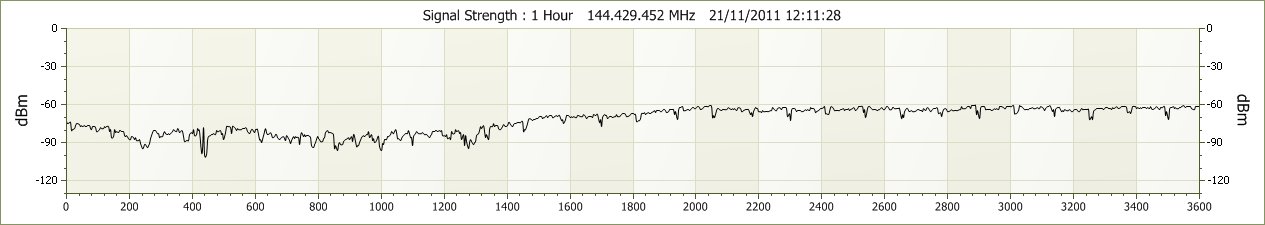
Towards the end of the recording the signal strength is bumping along at
S5-6 (-90dBm) and it's also a lot less stable than earlier. The regular dips in
the trace at the beginning are the WSJT tones sent by the beacon which produce
a slightly lower average S meter reading. The receiving hardware was a homebrew
144 MHz SDR that uses SDR-Radio by Simon Brown HB9DRV. In the 420 to 0 sec
section of the chart I did make some small adjustments to the receive filter
which will account for the two deep dips seen.
I thought it was interesting to see how the signal tailed off as rain
approached and started falling here. Simon Brown's SDR-Radio now has a very
useful S meter history feature. On Monday morning (21/11/11) the beacon was
very strong here so I just left the receiver running while I was away for a few
hours and returned to see the graph recorded. The drop in signal pretty much
coincided with the arrival of rain. It had been dry earlier but foggy, so when
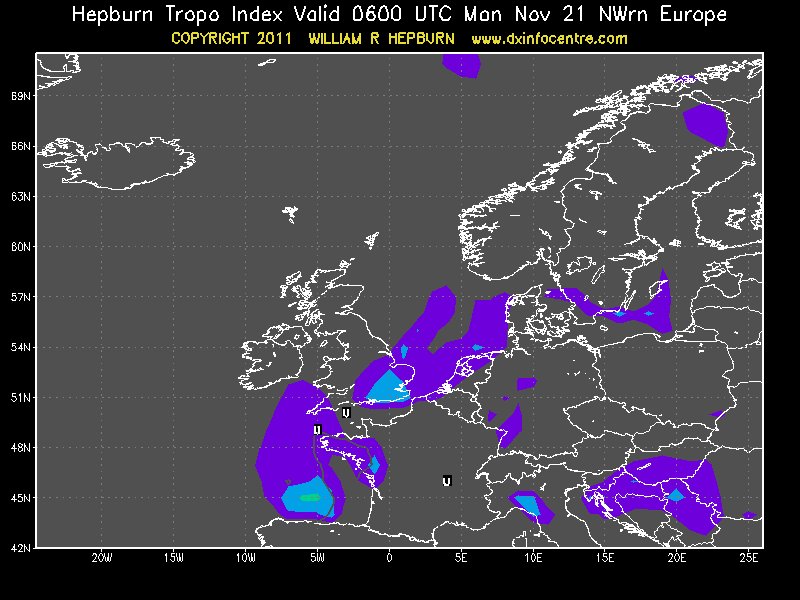
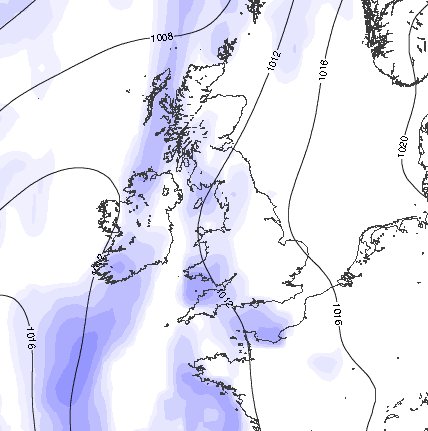
it started to rain it was a horrible day indeed. I made no local note of
atmospheric pressure but the data for the pressure and rainfall for the day is
shown below, together with the Hepburn data.
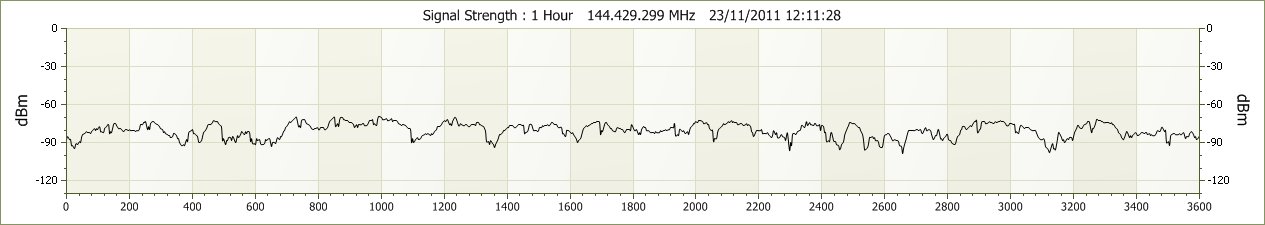
Two days later on the 23/11/2011 you can see by comparison with the
recording of the 21/11/2011, that the beacon is being received under more
normal propagation conditions with frequent peaks and troughs of QSB.
An interesting account of how Bill
GM3PMB uses the beacon's JT65B mode to monitor propagation over a period of
time
During March 2012, Bill GM3PMB located in IO74QJ monitored the
beacon for several hours and found a large variation in signal strength.
Although the beacon is at the limit of Bill's range of reception using
conventional CW, the use of JT65B enables propagation changes to be monitored.
Bill said "Over a period of about 90 minutes it never missed a decode. During
that period the signal strength went from -2 dB to -20dB so there was a
substantial propagation swing. You will see much evidence of aircraft multipath
and enhancement but that does not seem to completely explain the deep
QSB".
